NIFTY 22700 PE Option Analysis
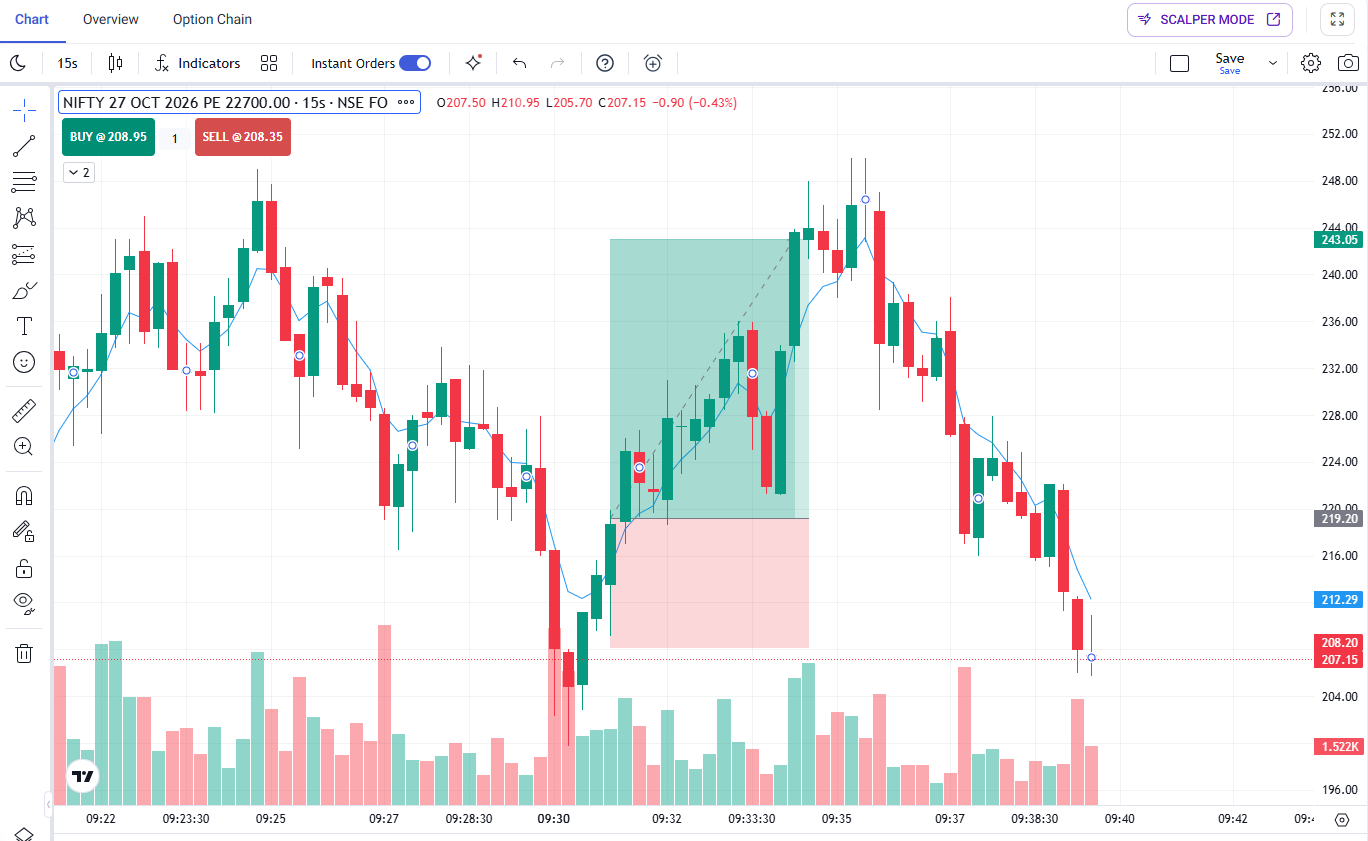
The NIFTY 27 October 2026 22700 Put Option showed a sharp intraday reversal on the 15-second chart. The premium initially recovered from lower levels and moved towards ₹244–₹246 before facing selling pressure. Following this recovery, the option premium declined significantly and reached approximately ₹207.15 in the displayed snapshot.
This price movement highlights how quickly option premiums can change during intraday trading. Short-term traders should pay attention to price structure, momentum, volume and risk management rather than relying on a single candle or indicator.
Note: The levels discussed below are approximate values taken from the supplied chart screenshot. They are not live prices or guaranteed future targets.
1. Overview of the NIFTY 22700 PE Chart
The screenshot displays the NIFTY 27 October 2026 22700 PE contract on a 15-second timeframe.
Key observations from the chart include:
- The premium initially traded around the ₹230–₹244 region, with intermittent price fluctuations.
- Selling pressure pushed the premium towards the ₹204–₹205 area around 09:30.
- A recovery followed, taking the premium towards ₹243–₹246.
- The recovery failed to sustain its momentum, and the premium subsequently moved lower.
- Towards the end of the displayed chart, the premium fell to approximately ₹207.15.
The sequence shows a recovery followed by a strong bearish reversal in the option premium.
2. Strong Recovery from Lower Levels
Around 09:30, the option premium experienced a sharp decline towards ₹204–₹205. Buyers then appeared to support a recovery, with several green candles pushing the premium higher.
The recovery moved through the ₹216–₹220 area and continued towards ₹230 and above. The premium eventually approached the ₹243–₹246 zone.
However, a rising premium alone does not confirm that an uptrend will continue. Traders also need to assess whether the price can sustain higher levels, form higher lows and maintain
buying momentum.
3. Rejection Near ₹244–₹246
The ₹244–₹246 area acted as a potential resistance zone in the displayed snapshot. After approaching this region, the premium failed to sustain its upward movement and reversed lower.
The subsequent decline included multiple bearish candles, indicating strong downward momentum in the option premium during that part of the session.
A rejection near resistance can be useful information for chart analysis, but it is not a standalone trading signal. Confirmation from price structure and broader market movement is important.
4. Important Support and Resistance Levels
The following zones are approximate and based only on the supplied screenshot.
| Price zone |
Technical observation |
| ₹244–₹246 |
Potential resistance area where the recovery stalled |
| ₹232–₹236 |
Intermediate zone during the recovery and subsequent decline |
| ₹219–₹220 |
Short-term price area visible during the reversal |
| ₹212–₹213 |
Nearby reference zone before the final sharp decline |
| ₹204–₹208 |
Lower area reached during the displayed price swings |
These zones should be treated as reference points rather than exact entry or exit levels. A level can break, fail or behave differently as market conditions change.
5. Bearish Momentum After the Reversal
After the premium failed to hold near ₹244–₹246, the chart showed a series of lower
price movements. The decline extended below the ₹236 and ₹220 areas, followed by another sharp drop towards ₹207.15.
The blue moving-average line also turned downward during the later portion of the chart. This supports the observation that short-term momentum had weakened, although a moving average is a lagging indicator and cannot predict future prices reliably.
The final candles suggest that selling pressure remained strong at the time represented by the screenshot.
6. What Does Volume Indicate?
The volume bars at the bottom of the chart vary throughout the displayed period. Some larger bars appear around the sharp decline and recovery, as well as during the later sell-off.
Increased volume during a price move can help traders assess the strength of market participation. However, volume alone does not establish the reason for a move or confirm its continuation.
Option premiums can also change because of movements in the underlying NIFTY index, implied volatility, time decay and changes in bid-ask spreads.
For a more complete analysis, traders should compare the option chart with the underlying NIFTY chart and relevant market data.
7. Important Lessons for Intraday Option Traders
This chart offers several educational takeaways:
Avoid chasing a sharp recovery. A fast rise in an option premium can reverse quickly when price fails to sustain higher levels.
Watch resistance zones. Previous swing highs can help identify areas where the price may face selling pressure, but resistance is never guaranteed to hold.
Use more than one signal. Price action, volume, the underlying index and market conditions should be considered together.
Define risk before entering. Decide how much capital you can afford to risk and understand your exit conditions before placing a trade.
Respect the timeframe. A 15-second chart can contain substantial noise and rapid price fluctuations. It should not be used in isolation for major trading decisions.
Conclusion
The NIFTY 27 October 2026 22700 PE chart showed a strong recovery from approximately ₹204–₹205 towards ₹244–₹246, followed by a sharp bearish reversal to around ₹207.15 in the supplied snapshot.
The key technical observation is the failure to sustain the recovery near the upper price zone, followed by lower prices and weakening short-term momentum. For educational chart reading, this highlights the importance of resistance, momentum confirmation, volume analysis and disciplined risk management.
Market conditions can change quickly, and historical chart behaviour does not guarantee future performance.
Disclaimer: This article is for educational and informational purposes only. It is not investment advice or a recommendation to buy or sell any option. Options trading involves substantial risk and may result in significant losses. Always conduct your own research and consult a qualified financial adviser if needed.
Published by Stock Market Hub — Stock Market Education and Technical Analysis.