

Bitcoin Price Analysis: Pump, Dump and Recovery | BTC/USD

Bitcoin Price Analysis: Is BTC Recovering?
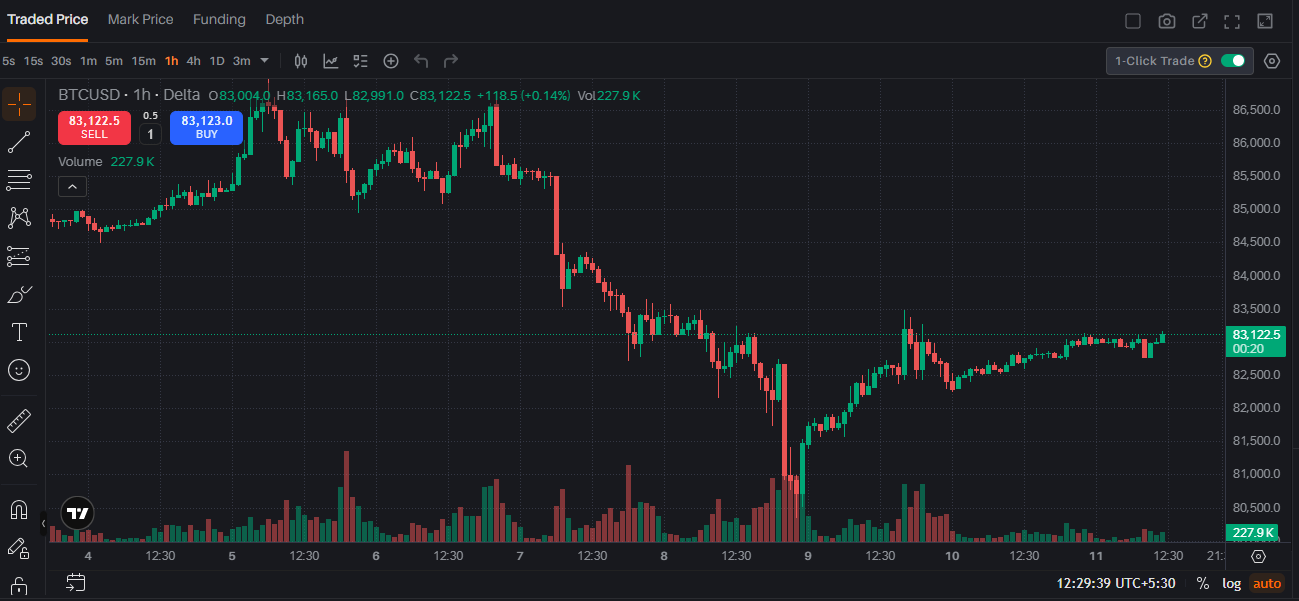
Bitcoin (BTC/USD) on the Delta Exchange 1-hour chart shows a classic pump, dump, and recovery consolidation pattern. Between October 4 and 6, 2026, BTC rallied from around $84,000 to $86,500 before facing strong selling pressure.
On October 8–9, Bitcoin dropped sharply toward $80,500, accompanied by a significant increase in selling volume. The price has since recovered to approximately $83,122.50, suggesting renewed buying interest.
Key Levels to Watch
- Resistance: $84,000–$84,500
- Major Resistance: $86,500
- Support: $82,000–$80,500
What’s Next for Bitcoin?
If BTC holds its recovery and breaks above nearby resistance, bullish momentum could strengthen. However, rejection near resistance may lead to further consolidation or another move lower. Traders should monitor volume and price confirmation before entering a position.
Final Thoughts: Bitcoin’s recent movement highlights the importance of tracking price action, volume, and key support and resistance zones rather than reacting emotionally to sudden market swings.
Disclaimer: This article is for educational purposes only and is not financial advice. Cryptocurrency trading involves substantial risk.