

SENSEX 1-Minute Chart Analysis: Bearish Trend and Key Levels

SENSEX Intraday Analysis: Selling Pressure Continues
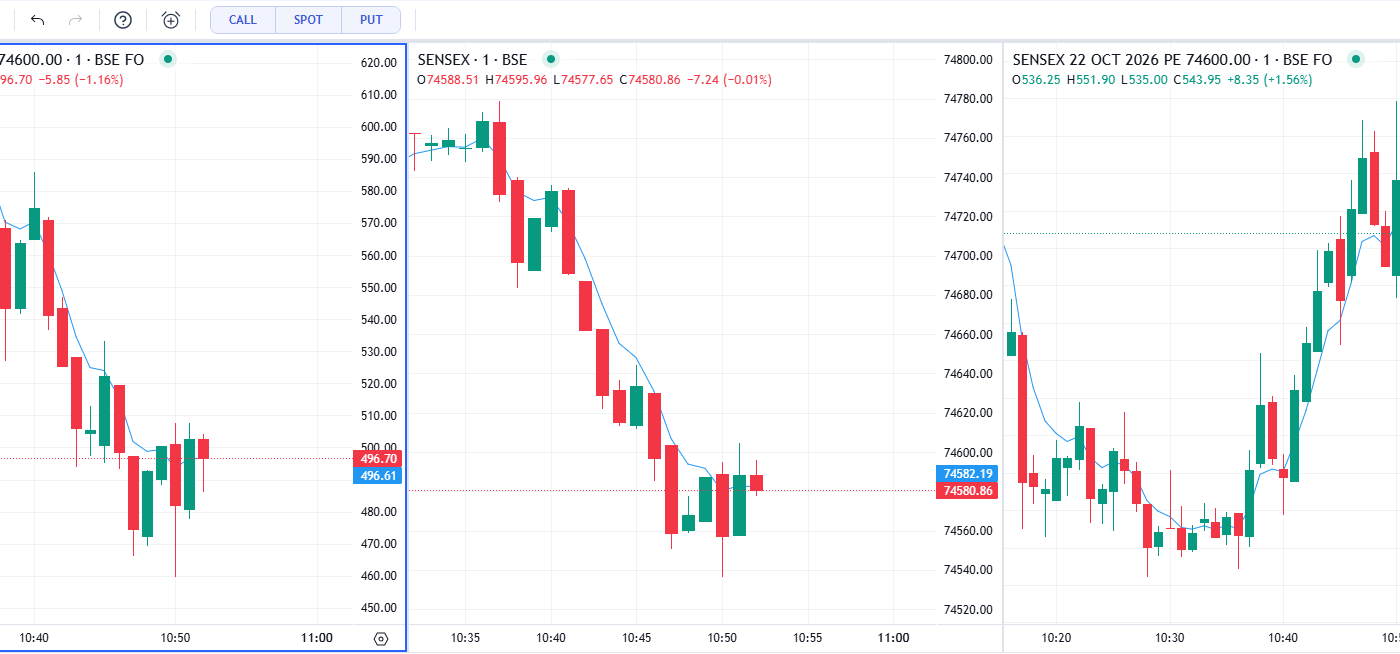
The SENSEX 1-minute chart shows strong intraday selling pressure, with the index falling from around 74,760 to 74,581. Price is trading below the blue moving-average line, indicating that short-term momentum remains bearish in this chart snapshot.
The 74,600–74,620 zone may act as near-term resistance. On the downside, traders can watch the 74,560 area, followed by 74,540, as potential support zones.
The options charts support the bearish reading: the 74,600 CE has dropped to around ₹496.70, while the 74,600 PE has risen to around ₹543.95. However, option premiums are also affected by volatility and time decay.
Key Levels to Watch
- Resistance: 74,600–74,620
- Support: 74,560 and 74,540
- Short-term trend: Bearish unless price recovers above resistance
Traders should wait for price confirmation and manage risk carefully instead of relying on a single candle or option premium movement.
Disclaimer: This analysis is for educational purposes only, not financial advice. Options trading carries significant risk.