
1:2 Risk Reward Nifty Setup: Simple Intraday Trade

A clearly defined 1:2 risk-reward Nifty setup can help traders plan an intraday trade before entering the market. Instead of entering randomly, the trader first identifies important price levels and then defines the potential risk and reward.
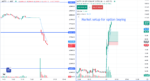
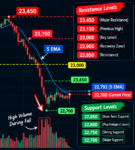
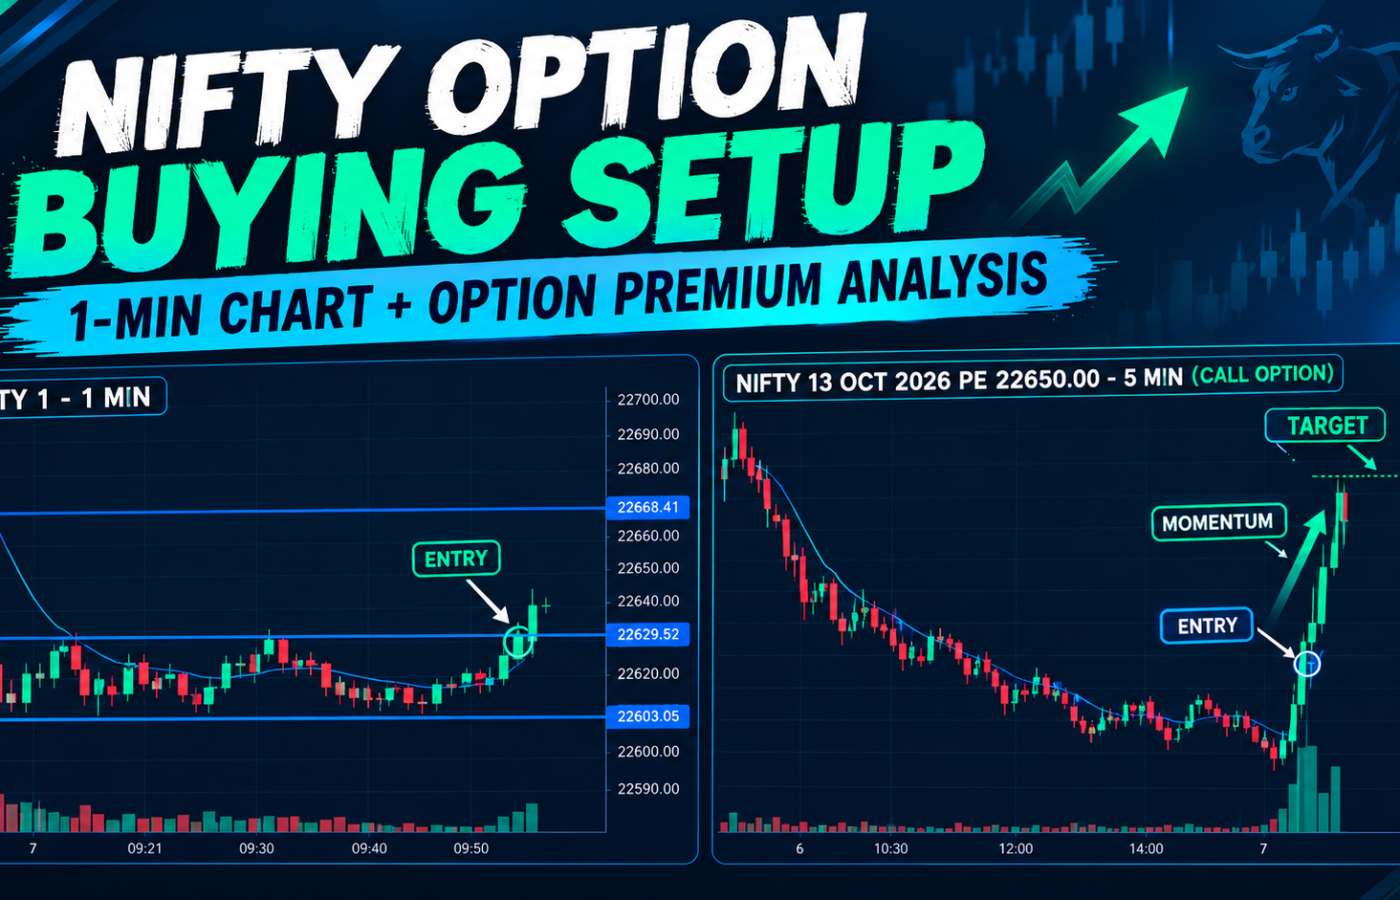
The chart provided shows Nifty on the 1-minute timeframe along with a Nifty 13 OCT 2026 22650 PE chart on the 5-minute timeframe. Several important support and resistance levels are marked on the Nifty chart.
Key Levels on the Chart
The chart highlights the following important levels:
- 22,668.41 – Upper resistance
- 22,629.52 – Key resistance/reference level
- 22,602.92 – Lower support
These levels can be used to monitor potential breakout, breakdown, and price-reaction scenarios.
How Does a 1:2 Risk-Reward Setup Work?
A 1:2 risk-reward ratio means that the planned potential reward is twice the amount being risked.
For example:
- Risk: ₹500
- Potential Reward: ₹1,000
- Risk-to-Reward: 1:2
Similarly, if the planned risk is ₹1,000, a 1:2 structure would target a potential reward of ₹2,000.
These numbers are examples for explaining the risk-reward concept and are not guaranteed returns.
Entry, Stop Loss and Target
For a Nifty intraday setup, traders can first identify the important support and resistance levels.
If price gives a confirmed breakout above resistance, a bullish setup may develop. Conversely, a confirmed breakdown below support may create a bearish setup.
Before entering a trade, the trader should define:
Entry → Stop Loss → Target
The stop loss should be placed at the level where the original trade idea becomes invalid. The target can then be calculated using the planned 1:2 risk-reward ratio.
Why Backtesting Matters
A single chart cannot prove that a trading setup will remain profitable.
The setup should be tested across multiple historical Nifty sessions to evaluate how it behaves in different market conditions.
During backtesting, record:
- Entry price
- Stop-loss level
- Target
- Risk per trade
- Reward
- Winning trades
- Losing trades
- Win rate
- Maximum losing streak
This can provide a more objective view of the setup’s historical performance.