


Nifty 50 Chart Analysis: Sharp Selling Pushes Index Below 22,800 — What the 15-Minute Chart Shows

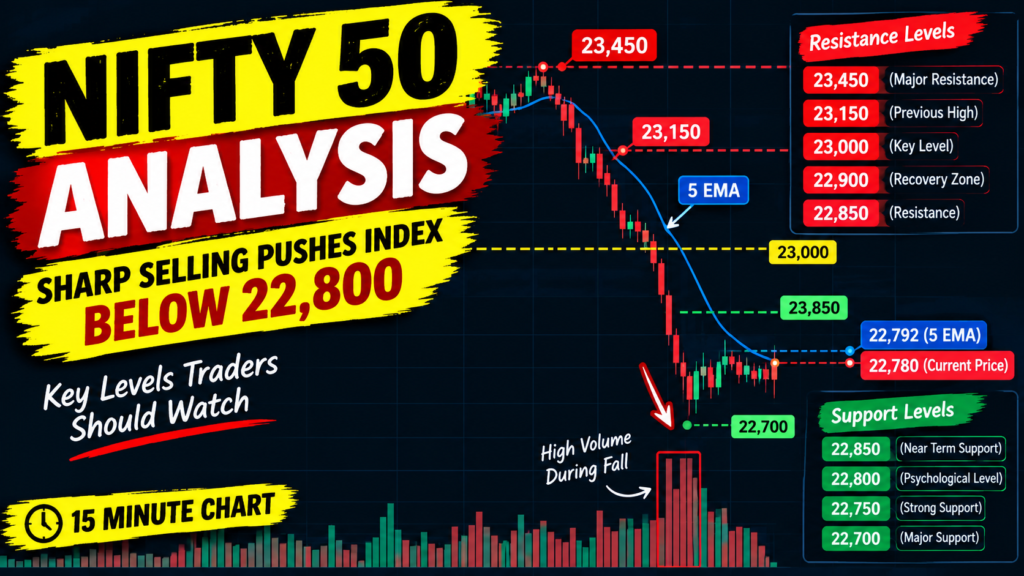
The Nifty 50 chart is telling a fairly clear story right now: sellers are in control of the short-term trend.
Looking at the 15-minute chart, the index has moved sharply lower from the 23,400–23,450 zone and is now trading around 22,780. What makes the decline interesting is that the selling has not been limited to one or two candles. The chart shows a series of lower levels, followed by weak rebounds that have struggled to change the broader direction.
For intraday traders, this is the part of the chart that matters.
The question is no longer simply why Nifty fell. The bigger question is whether the index can find support around the current levels or whether another selling wave develops.
Nifty 50 15-minute chart shows a clear change in momentum
Earlier in the chart, Nifty was trading comfortably above 23,300 and even moved toward the 23,450 area.
The structure then changed.
After reaching the upper levels, the index started making lower highs and lower lows. The decline became particularly aggressive around the 24th and again around the 28th, when selling pressure increased sharply.
The move from roughly 23,150 to below 22,900 stands out on the chart.
Once that support area gave way, buyers struggled to recover the lost ground.
Nifty then entered a relatively narrow range around 22,800–22,850. That usually becomes an important area to watch because the market is effectively deciding whether to stabilize or continue the existing trend.
The 5 EMA is currently acting as a short-term hurdle
One of the simplest things visible on the chart is the 5 EMA.
The EMA is currently around 22,792, while Nifty is around 22,780.
That means the index is trading slightly below its short-term moving average.
On a 15-minute chart, traders often use a short EMA like this to judge immediate momentum. When price stays below the EMA during a falling market, every move back toward the average can become an area where sellers attempt to re-enter.
That is exactly what makes the current setup worth watching.
A sustained move above the 5 EMA would not automatically reverse the entire trend. But it could be the first indication that selling pressure is losing some strength.
On the other hand, repeated rejection around the EMA would keep the short-term bearish structure intact.
22,800 is now an important psychological level
The index is hovering around the 22,800 mark, which is also psychologically important round number.
The chart shows Nifty closing around 22,780.25, with the 5 EMA slightly higher at approximately 22,792.36.
That creates a very simple short-term observation:
Nifty is below both the 22,800 area and the 5 EMA.
For buyers, getting back above this zone and holding it would be useful confirmation that the immediate selling pressure is easing.
For sellers, a failure to reclaim this area could keep the pressure on.
This is why traders should avoid looking at 22,800 as just another number on the chart. The market’s reaction around this level could provide more information than the level itself.
What happened near 23,000?
The 23,000 region was another important area during the decline.
When Nifty broke sharply lower from around 23,050–23,100, the market did not immediately recover. Instead, the index spent time below that zone and eventually moved toward 22,800.
That tells us something about the current structure.
A level that previously acted as support can become resistance after it breaks.
So if Nifty manages to recover, the 23,000 area could become an important test.
A move from 22,780 to 23,000 may look like a strong recovery in percentage terms, but technically it would still be a bounce until the index starts reclaiming higher levels and building a stronger price structure.
22,850–22,900 could be the first recovery zone
Looking closely at the right side of the chart, Nifty spent considerable time around 22,800–22,850 after the sharp fall.
This makes that zone important for the next move.
If the index moves above 22,850 and starts holding there, traders could watch whether it can push toward 22,900 and then 23,000.
But if Nifty repeatedly reaches this region and gets rejected, it would show that sellers are still active.
This is where the 15-minute time frame becomes useful.
Instead of reacting to every candle, traders can wait for the market to show whether a level is actually being accepted or rejected.
Where is the immediate support?
Based on the chart structure, the 22,750–22,700 area is an important zone to watch on the downside.
The latest candles are sitting close to this region.
A clean break below the recent low, especially if accompanied by stronger selling volume, could open the door for another leg lower.
But there is an important distinction here.
A single candle moving below support does not always mean that the breakdown is genuine. Markets frequently make false breaks, particularly around important intraday levels.
For that reason, traders may want to watch the candle close and the follow-through rather than reacting to the first move.
Volume is also giving some clues
The volume bars at the bottom of the chart become noticeably larger during some of the sharp downward moves.
That is worth paying attention to.
A price decline accompanied by increased volume generally tells us that participation has increased during that move. It doesn’t, by itself, guarantee that the market will continue falling, but it makes the move more significant than a decline happening on very low activity.
The sharp selling around the 28th is particularly noticeable.
After that move, Nifty did not immediately recover the previous range. Instead, it started consolidating at lower levels.
That is not the strongest sign for buyers.
Nifty trend: sellers still have the advantage on this chart
If we ignore the headlines and simply read the price structure, the 15-minute chart currently looks weak.
The sequence is roughly:
23,450 → 23,200 → 23,050 → 22,900 → 22,800
The important point is not the exact numbers.
It is the direction.
The market has repeatedly moved to lower levels.
Until that structure changes, buying every small dip can be risky because a falling market can continue to remain weak longer than an intraday trader expects.
For a bullish setup to become more convincing, traders would want to see Nifty reclaim important levels and then hold them rather than immediately falling back below them.
What should Nifty traders watch next?
There are a few levels that stand out from this chart.
| Nifty Zone | What to Watch |
|---|---|
| 22,700–22,750 | Immediate downside support zone |
| 22,800 | Psychological level/current price area |
| 22,850–22,900 | First recovery/resistance zone |
| 23,000 | Important psychological and technical level |
| 23,050–23,150 | Previous trading area and stronger resistance |
| 23,400–23,450 | Major higher resistance visible on the chart |
These aren’t guarantees of where Nifty will move next. They are simply areas where the chart shows previous activity and where price could react.
What does the chart mean for option traders?
This is where things become especially important.
When Nifty is trending lower on a 15-minute chart, option buyers can be tempted to immediately buy Put options.
That can work when the move continues.
The problem comes when the trader enters after a large fall without waiting for confirmation.
A falling market can suddenly bounce 50–100 points, and option premiums can react very quickly.
The chart therefore suggests that confirmation is more important than simply predicting direction.
For example, a trader watching the bearish setup could look for rejection near a resistance zone rather than blindly entering a PE after every red candle.
Similarly, someone looking for a bullish trade could wait for Nifty to reclaim an important level and show that buyers are actually able to hold it.
The chart itself does not tell us which option to buy.
It tells us where the market is strong, where it is weak and where the next decision may happen.
Nifty 50 outlook from the 15-minute chart
At the moment, the short-term structure remains weak.
Nifty is trading below the 5 EMA, the recent price structure is making lower levels, and the index has not yet recovered the major areas lost during the sell-off.
The first thing I would watch is the reaction around 22,700–22,800.
If this area holds and Nifty starts reclaiming 22,850–22,900, the short-term recovery could gain some strength.
A move back toward 23,000 would then become more interesting.
But if 22,700 breaks decisively and sellers continue to dominate, the chart could remain under pressure.
For now, the cleanest way to read the chart is simple:
Below 22,800, the short-term structure remains weak. Above 22,900, the recovery starts becoming more interesting. Around 22,700, the market faces an important support test.
The next move will depend on how Nifty reacts around these areas rather than on any single candle.
Final Takeaway
The Nifty 50 15-minute chart has changed dramatically from the earlier 23,400–23,450 region.
What started as a decline has developed into a clear short-term downtrend, with the index now trading around 22,780.
The 5 EMA near 22,792 is currently sitting just above the market, while 22,700–22,750 becomes an important area to watch on the downside.
For traders, this is not necessarily the time to chase every move.
The better approach is to let Nifty show its hand around the important levels.
A sustained recovery above the short-term resistance zones would change the picture. A breakdown below the recent support would keep sellers in control.
And for option traders, one thing is worth remembering:
The best trade is not always the first trade. Sometimes waiting for confirmation is the trade.