
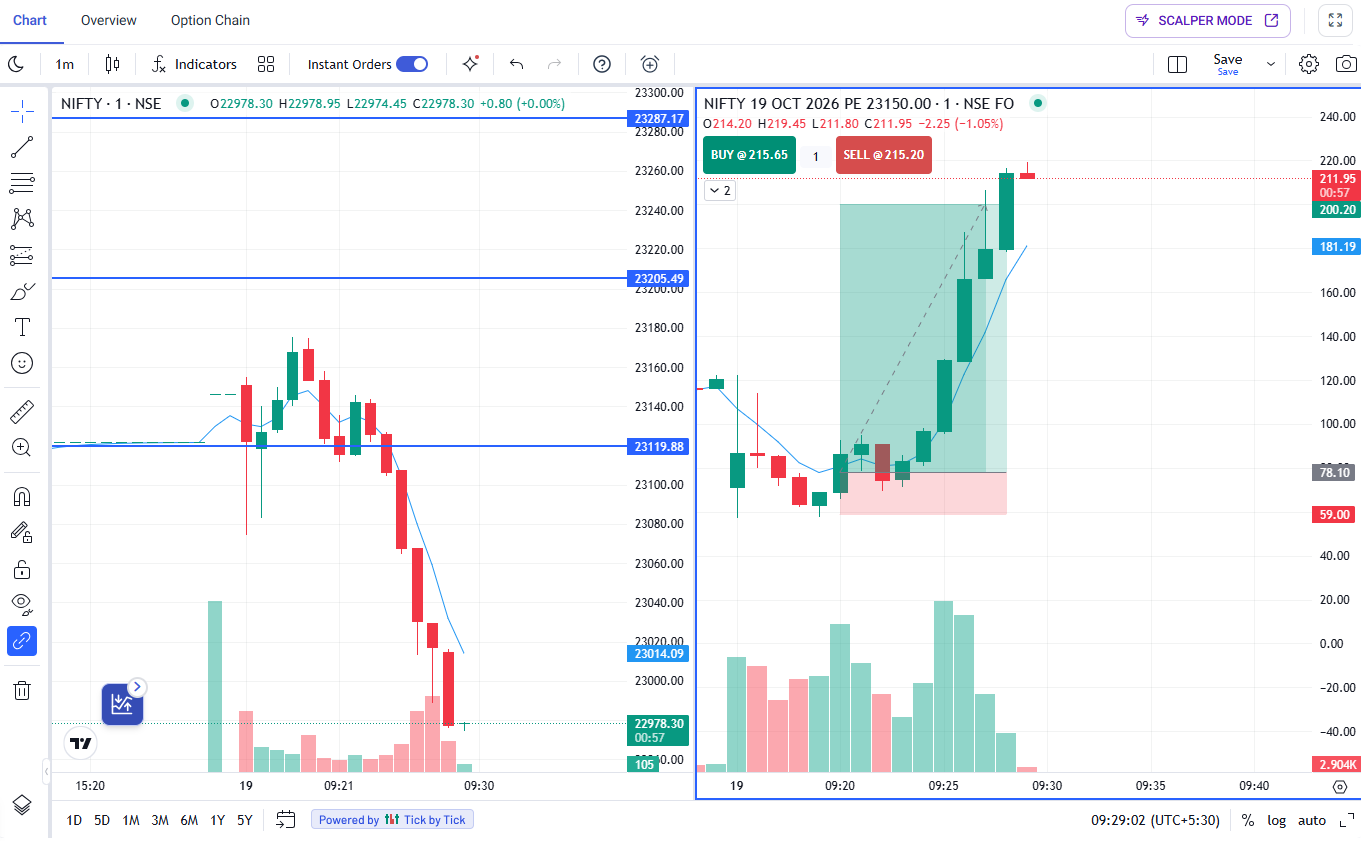
NIFTY Intraday Chart Analysis: 3 Key Levels to Watch

NIFTY Rebounds After a Sharp Fall
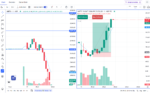
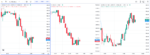
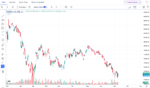
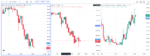
The NIFTY 1-minute chart shows a sharp fall toward 22,980, followed by a strong recovery to around 23,140. The index has moved back above the marked support zone near 23,120, suggesting a short-term recovery in price action.
The immediate resistance area is around 23,160–23,180, while 23,120 is an important level to watch for support. If the index holds above this zone, recovery momentum may continue; a move below it could signal renewed weakness.
The 23,150 PE chart shows a sharp rise followed by a steep decline, with the premium near ₹83.85 in the snapshot. This highlights how quickly option premiums can change during volatile market conditions.
Key Levels
- Resistance: 23,160–23,180
- Support: Around 23,120
- Market view: Recovery after a sharp intraday decline
Wait for price confirmation before making a trading decision, and use strict risk management.
Disclaimer: This article is for educational purposes only and is not financial advice. Options trading involves significant risk.