
Nifty Intraday Trading Setup: 5 Key Levels to Watch

Intraday Nifty trading becomes easier to analyze when traders focus on price structure, important support and resistance levels, and confirmation rather than chasing every market move.
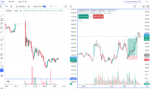
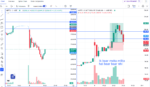
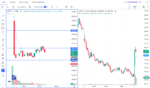
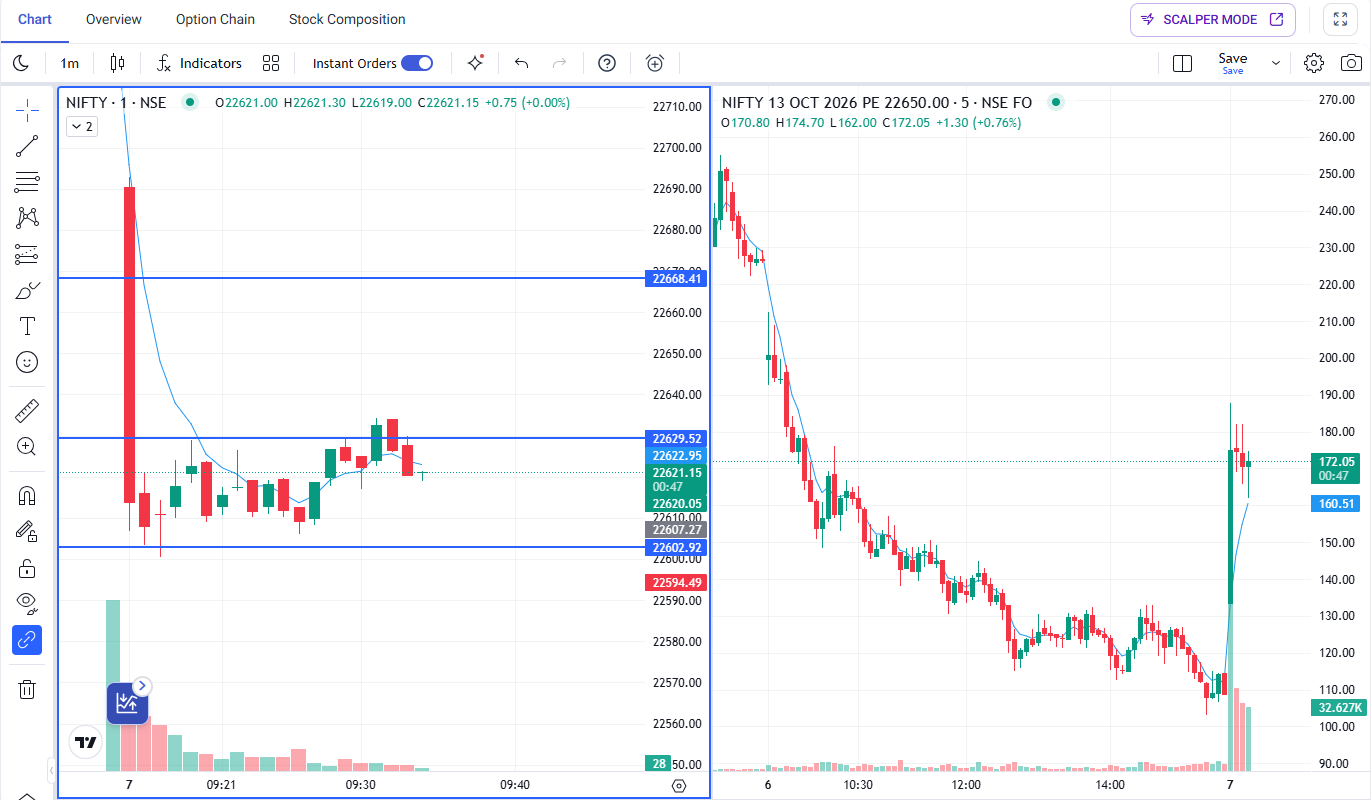
The chart in this setup combines a 1-minute NIFTY chart on the left with a 5-minute NIFTY option chart on the right. The price action shows an early decline, a recovery, and then a period of consolidation around an important intraday level.
This makes the chart useful for understanding how traders can build a structured intraday plan.
Disclaimer: This article is for educational purposes only. It is not financial advice. Nifty and options trading involve significant risk, and a chart setup does not guarantee a profitable trade.
What Does the Nifty Chart Show?
The left side of the chart shows NIFTY on the 1-minute timeframe.
The market initially moves lower before recovering toward the 22,550–22,570 area.
After the recovery, price begins moving sideways, indicating a period of consolidation rather than a strong immediate trend.
An important horizontal level is marked around:
22,588.44
The current price shown on the chart is around:
22,550.25
This makes the 22,588 area an important level to monitor for a possible price reaction.
Key Resistance Level: 22,588
The blue horizontal line around 22,588.44 is one of the most visible levels on the Nifty chart.
Price is trading below this level in the displayed setup.
Instead of assuming that the level will automatically break, traders can watch how price behaves when it approaches the resistance.
A strong move above the level with confirmation could indicate improving bullish momentum.
On the other hand, repeated rejection from the level could keep the market range-bound or create another move toward lower support.
Nifty Support Area
The chart also shows price reacting around the 22,540–22,550 region after the earlier decline.
This area can be treated as an important short-term price-action zone in the context of the displayed chart.
If buyers continue defending this area, price may attempt another move toward the higher resistance.
If the support area fails decisively, traders may need to reassess the short-term market structure.
The important point is to wait for confirmation instead of entering simply because price reaches a level.
EMA 5 and Short-Term Momentum
The 1-minute chart also displays an EMA 5.
A short-period EMA can help visualize very short-term momentum.
In the chart, the EMA follows the recent price movement and provides additional context for the intraday structure.
However, an EMA should not be treated as a standalone buy or sell signal.
A better approach is to combine it with:
- Support and resistance
- Price action
- Breakout or breakdown confirmation
- Volume
- Option-price movement
What Does the Option Chart Show?
The right side of the image shows a 5-minute NIFTY option chart.
The option price experienced a strong upward movement earlier in the session, moving from approximately the ₹110–₹120 area toward ₹150–₹160 before pulling back and entering a more sideways phase.
At the right side of the chart, the option is trading around ₹140.
This shows why option-price movement should be analyzed alongside the underlying Nifty chart.
A strong move in the option does not necessarily mean that the same momentum will continue indefinitely.
Avoid Chasing a Strong Option Move
One of the most important observations from this chart is the difference between the earlier strong option movement and the later consolidation.
After a sharp move, the option begins moving within a relatively narrower range.
This is where traders can make the mistake of entering late simply because the option has already moved significantly.
A more disciplined approach is to wait for a fresh setup.
For example:
Nifty level → Confirmation → Option reaction → Entry → Stop Loss → Target
This keeps the underlying index at the center of the analysis.
Simple Nifty Intraday Trading Plan
Based on the displayed chart, traders can organize the setup around the following levels:
Bullish Scenario
If Nifty breaks above the 22,588 resistance area with convincing price action, traders can watch for confirmation before considering a bullish setup.
The option chart should also show corresponding strength.
Bearish Scenario
If Nifty fails to break resistance and subsequently loses the nearby support area, bearish momentum may become relevant.
Again, confirmation is important before taking any position.
No-Trade Scenario
If Nifty continues moving sideways between the important levels without clear confirmation, staying out can also be a valid decision.
Not every market condition provides a high-quality trading opportunity.
Why Waiting for Confirmation Matters
The chart demonstrates an important lesson about intraday trading.
Price can move quickly in one direction and then suddenly enter consolidation.
Therefore, traders should avoid making decisions based only on:
- One candle
- One EMA crossover
- One support level
- One resistance level
- A sudden option-price movement
Instead, multiple pieces of information should support the trade idea.
Nifty Intraday Setup Checklist
Before entering a trade, check:
- Is Nifty above or below the important level?
- Is price breaking resistance or support?
- Is the breakout confirmed?
- Is the market trending or consolidating?
- Is the option showing corresponding momentum?
- Where is the invalidation level?
- What is the stop loss?
- What is the planned target?
- Is the risk-to-reward acceptable?
If the setup does not meet your predefined rules, there is no need to force a trade.