NIFTY Intraday Analysis: Bears Remain in Control
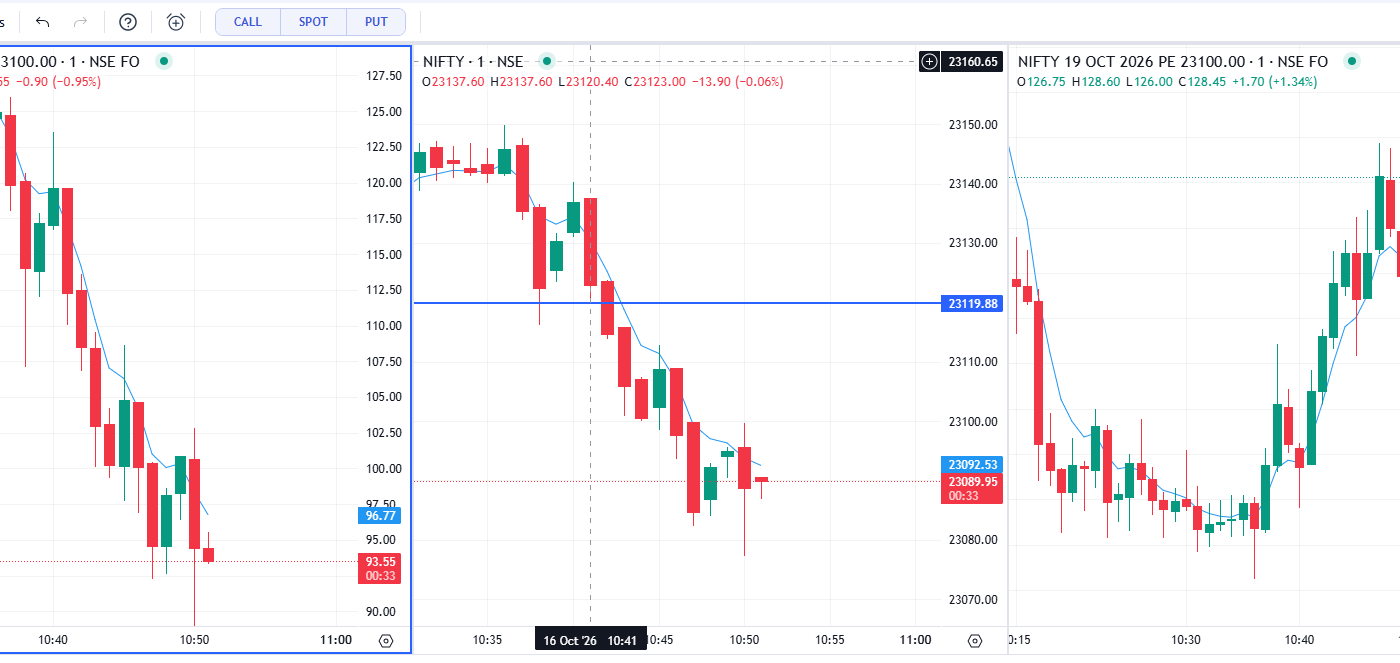
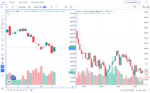
The NIFTY 1-minute chart shows strong selling pressure, with the index falling from around 23,145 toward 23,090. Price is trading below the blue
moving-average line, suggesting short-term bearish momentum.
The
23,120 zone is an important resistance area. If NIFTY remains below this level, selling pressure may continue. Immediate support is near
23,080, while a break below it could lead to further weakness.
The options chart also shows contrasting price action: the
23,100 CE has declined sharply, while the
23,100 PE has recovered strongly. This reflects bearish intraday sentiment in the displayed snapshot, although option prices can also be affected by volatility and time decay.
Key Levels to Watch
- Resistance: 23,100–23,120
- Immediate support: Around 23,080
- Trend: Short-term bearish while price stays below resistance
Traders should wait for price confirmation rather than entering based on a single candle. These levels are approximate and specific to the chart snapshot.
Disclaimer: This article is for educational purposes only and is not financial advice. Trading options involves significant risk.

 NIFTY 1-Minute Chart Analysis: Bearish Trend and Key Levels
 RBI’s 3-Pronged War on Inflation: How India’s Central Bank Is Fighting Rising Prices
 Nifty Daily Chart Analysis: Key Support and Resistance Levels
 You Don’t Need Big Moves to Make Big Money — This 12 October Setup Proves It
 Nifty 22600 PE Trade: Target Hit in Just 7 Minutes