
Nifty 22600 PE Trade: Target Hit in Just 7 Minutes

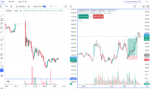
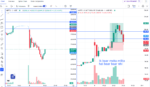
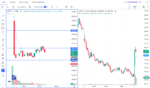
The latest Nifty 22600 PE trade setup highlights how a sharp move in the Nifty index can create a short-term opportunity in options trading. The chart shows Nifty’s 1-minute price action alongside the NIFTY 13 OCT 2026 22600 PE option chart.
Nifty Chart Analysis
The Nifty chart shows a strong upward move from the lower price area, followed by a quick rally and a pullback. Important levels on the chart include 22,403.48 as an upper reference level and 22,187.05 as a lower support reference. The sharp price movement indicates increased momentum, but traders should wait for confirmation instead of entering after a move has already occurred.Nifty 22600 PE Option Setup
The option chart shows a recovery from around ₹157 toward ₹192, with the marked target near ₹196.40 and the stop-loss level near ₹156.80. The chart annotation states that the target was hit in just seven minutes; however, the screenshot alone does not independently verify the exact execution time or realized profit. The setup illustrates the importance of defining entry, stop loss, and target before placing a trade.Key Trading Lessons
- Monitor Nifty’s price action before choosing an option trade.
- Wait for a clear setup and confirmation.
- Define the stop loss before entry.
- Avoid chasing sudden price movements.
- Backtest the strategy across multiple sessions.