


NIFTY 1-Minute Chart Analysis: 22750 PE Option Buying Setup Explained

Intraday traders often monitor the NIFTY price chart and option premium together to understand short-term market momentum. The chart shown above provides an interesting example of this approach.
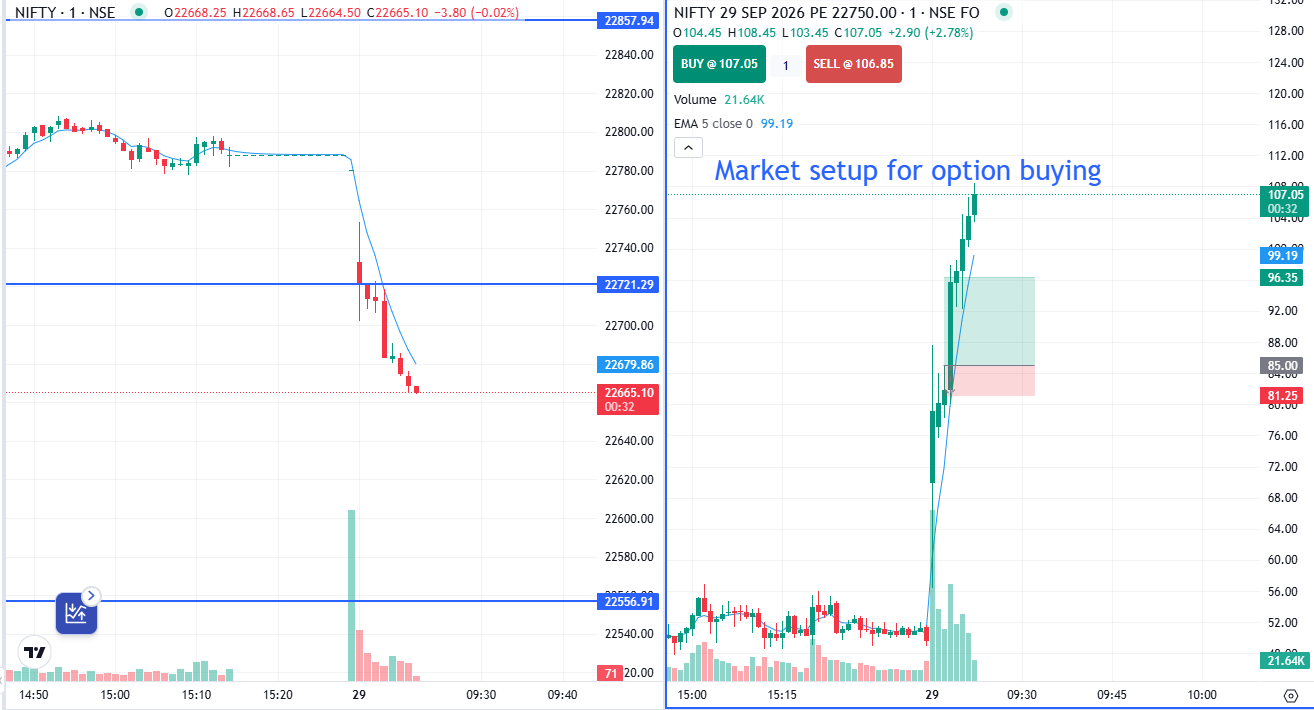
The left side of the screenshot shows the NIFTY 1-minute chart, while the right side shows the NIFTY 29 September 2026 22750 PE option chart.
The setup shows a sharp decline in NIFTY after an important intraday level was broken, while the 22750 PE premium moved sharply higher.
This article explains the visible chart structure, important price levels, momentum, volume, EMA, and the risk-management considerations involved in analyzing such an intraday option setup.
Disclaimer: This article is for educational and informational purposes only. It is not a recommendation to buy or sell any security or option. Options trading involves significant risk, and no technical setup guarantees a profit.
What Does the NIFTY 1-Minute Chart Show?
The left side of the screenshot displays the NIFTY 1-minute price chart.
Several important levels are marked on the chart:
- 22,721.29
- 22,679.86
- 22,556.91
At the beginning of the visible chart, NIFTY appears to be trading within a relatively narrow range around the 22,780–22,800 area.
The market then shows a sharp downward move.
One of the most important observations is the decline below the 22,721.29 reference level.
After this move, NIFTY continues lower toward the 22,679.86 area, while selling candles remain visible.
The chart also shows a noticeable increase in volume around the sharp price movement.
This makes the combination of price action, key levels, and volume important when analyzing the setup.
NIFTY 22750 PE Option Chart Analysis
The right side of the screenshot displays:
NIFTY 29 SEP 2026 PE 22750
on a 1-minute timeframe.
At the time visible in the screenshot, the option price is around ₹107.05.
The displayed market information includes:
- Buy: ₹107.05
- Sell: ₹106.85
- 5 EMA: ₹99.19
- Volume: 21.64K
The option premium shows a strong upward movement from the lower price area.
This upward movement occurs while the underlying NIFTY index is moving sharply downward.
That is an important observation because a put option can gain value when the underlying index declines, although the actual option premium is also affected by volatility, time to expiry, strike price, and other factors.
NIFTY Downside Movement and PE Premium
One of the clearest features of this chart is the relationship between the underlying index and the put option.
The visible sequence is broadly:
NIFTY declines → 22750 PE premium rises
On the NIFTY chart, the index breaks below the marked 22,721.29 level and continues lower.
At approximately the same time, the 22750 PE premium starts showing strong upward momentum.
For option traders, monitoring the underlying index first can therefore provide important context before analyzing the option premium.
However, this relationship should not be interpreted as an automatic trading signal.
Key NIFTY Levels Visible on the Chart
22,721.29
The 22,721.29 level is one of the most important marked levels in the screenshot.
NIFTY is shown moving below this level during the sharp sell-off.
A trader analyzing this type of setup could treat such a marked level as a reference point for determining whether price is maintaining or losing an intraday structure.
22,679.86
The next visible reference level is approximately 22,679.86.
After moving below 22,721.29, NIFTY continues toward this lower area.
This level can be monitored as another intraday reference point when studying the continuation of the downside move.
22,556.91
The lower blue level visible on the NIFTY chart is approximately 22,556.91.
This level is considerably below the price shown during the initial breakdown.
It can therefore be treated as a broader chart reference rather than assuming that it will automatically act as support.
Important Levels on the 22750 PE Chart
The option chart also contains several marked levels that help explain the structure.
₹107.05
The option premium is shown around ₹107.05 at the time captured in the screenshot.
The price has moved sharply higher into this area following the strong upside movement.
₹99.19 — 5 EMA
The chart displays a 5-period EMA at approximately ₹99.19.
A short-term moving average such as the 5 EMA can help traders observe short-term momentum.
In this screenshot, the option premium is trading significantly above the displayed EMA after the sharp upward movement.
That indicates strong short-term momentum in the visible portion of the chart.
However, an EMA should generally be treated as one component of technical analysis rather than as a standalone buy or sell signal.
₹96.35
Another visible reference level is approximately ₹96.35.
This area can be monitored as part of the short-term option-price structure.
If the premium continues to hold above an important reference level, traders may interpret the structure differently than they would after a decisive move below it.
₹85
The chart also shows a horizontal level around ₹85.
This is an important reference in the displayed setup.
Rather than automatically treating ₹85 as a guaranteed stop-loss, traders should understand why the level is being used and define risk according to their own position size and risk-management plan.
₹81.25
The lower red level is approximately ₹81.25.
This provides another downside reference on the option chart.
A move toward or below this area would represent a substantially different price structure from the strong upward momentum visible in the screenshot.
Why Volume Matters in This Setup
Volume is another important component of the chart.
On the NIFTY chart, a noticeable increase in volume appears around the sharp downward movement.
On the option chart, significant volume is also visible during the strong premium movement.
Volume can provide additional context when combined with price action.
A simple framework is:
Price + Key Level + Volume
For example, a move below a significant reference level accompanied by increased trading activity may deserve more attention than a move occurring on very low volume.
However, volume should not be treated as an independent guarantee of continuation.
How to Analyze a NIFTY Option Buying Setup
A structured approach can make chart analysis more consistent.
Step 1: Analyze NIFTY First
Before looking at the option premium, identify the underlying NIFTY trend.
Ask:
- Is NIFTY trending upward or downward?
- Is price near an important level?
- Has a significant level been broken?
- Is the move supported by volume?
Step 2: Identify the Breakout or Breakdown
The screenshot shows a clear downside movement after NIFTY moves below the marked 22,721.29 level.
A trader can monitor whether the move is sustained or whether price quickly returns above the broken level.
This distinction is important because not every breakout or breakdown continues.
Step 3: Check the Option Premium
Once the underlying movement is understood, analyze the relevant option.
In this case, the 22750 PE shows a strong upward movement while NIFTY moves downward.
This provides confirmation that the option premium is responding to the underlying move.
Step 4: Check the EMA
The 5 EMA shown on the option chart is approximately ₹99.19.
The premium is trading above this EMA during the strong upward movement.
This can be used as a short-term momentum reference.
Step 5: Check Volume
Look at whether the price movement is accompanied by meaningful volume.
In the screenshot, both NIFTY and the option show noticeable volume activity around the major movement.
Step 6: Define Risk Before Entry
Before taking any options trade, a trader should define:
- Entry conditions
- Invalidation level
- Stop-loss
- Position size
- Maximum acceptable loss
- Exit conditions
This is particularly important for 1-minute options trading because premiums can move very quickly.
Is This a Scalping Setup?
The screenshot uses a 1-minute timeframe, and the interface also displays Scalper Mode.
Therefore, the chart can be studied in the context of short-term intraday or scalping analysis.
However, 1-minute option trading comes with additional challenges.
A trader may experience:
- Rapid price fluctuations
- False breakouts
- Fast stop-loss triggers
- Bid-ask spread effects
- Sudden changes in option premium
- Increased emotional pressure
For this reason, the 1-minute chart can be combined with a higher-timeframe view to understand the broader market structure.
What Factors Affect NIFTY Option Premium?
A common mistake among new options traders is assuming that an option premium depends only on whether NIFTY is going up or down.
In reality, several factors can influence the premium.
1. Underlying NIFTY Price
The movement of NIFTY is a major factor affecting the option’s value.
2. Implied Volatility
Changes in implied volatility can significantly affect option premiums.
3. Time to Expiry
As expiry approaches, time decay becomes increasingly relevant.
4. Strike Price
The behavior of the 22750 PE can differ from other NIFTY put strikes.
5. Liquidity
Bid-ask spreads and trading volume can affect the practical execution of an options trade.
Risk Management for NIFTY Option Buying
A technically correct market direction does not automatically mean that an option trade will be profitable.
Option buyers should consider:
Position Sizing
Avoid taking a position that exposes too much capital to a single trade.
Stop-Loss
Define the maximum acceptable loss before entering the trade.
Risk-to-Reward Framework
Consider potential upside relative to the amount being risked.
Time Decay
Option buyers need to account for the impact of time decay, particularly as expiry approaches.
Avoid Overtrading
A fast-moving 1-minute chart can create many apparent setups. Not every movement needs to become a trade.
NIFTY 22750 PE Setup: Key Observations
| Parameter | Chart Observation |
|---|---|
| Underlying | NIFTY |
| Timeframe | 1 Minute |
| Option | NIFTY 29 Sep 2026 22750 PE |
| Displayed Option Price | Approximately ₹107.05 |
| 5 EMA | Approximately ₹99.19 |
| NIFTY Reference Level | 22,721.29 |
| NIFTY Reference Level | 22,679.86 |
| Lower NIFTY Level | 22,556.91 |
| Option Reference | ₹96.35 |
| Option Reference | ₹85 |
| Lower Option Reference | ₹81.25 |
| Setup Context | Intraday / Scalping |
| Main Observation | NIFTY weakness accompanied by PE premium strength |
NIFTY 1-Minute Chart Analysis: Key Takeaways
The screenshot highlights several important technical observations.
First, NIFTY shows a sharp downside move after breaking below the marked 22,721.29 level.
Second, increased volume appears around the major movement, adding context to the price action.
Third, the 22750 PE premium moves sharply higher while NIFTY declines.
Fourth, the option price moves above its displayed 5 EMA of approximately ₹99.19, indicating strong short-term momentum in the visible chart.
Finally, levels such as ₹96.35, ₹85 and ₹81.25 can be used as reference points for analyzing the option’s price structure, rather than treating them as guaranteed support or stop-loss levels.
Frequently Asked Questions
What is NIFTY 1-minute chart analysis?
NIFTY 1-minute chart analysis involves studying price candles where each candle represents approximately one minute of market activity. It is commonly used for short-term intraday analysis and scalping.
What happens to a PE option when NIFTY falls?
A put option can increase in value when the underlying NIFTY declines. However, the premium is also affected by implied volatility, time decay, strike price, liquidity, and other option-pricing factors.
What does the 5 EMA indicate?
The 5 EMA is a short-term moving average that can help traders observe recent price momentum. It should not be considered a standalone trading signal.
Can the 1-minute chart be used for scalping?
Yes. A 1-minute chart can be useful for short-term trading analysis, but it can also produce significant noise and rapid price movements. Risk management is therefore particularly important.
Is buying NIFTY options profitable?
There is no guaranteed profit in options trading. Option prices can move rapidly against a position, and traders can lose some or all of their invested premium.