Nifty Daily Chart Analysis: Key Support and Resistance Levels

Nifty Daily Chart Analysis
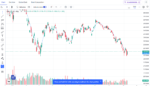
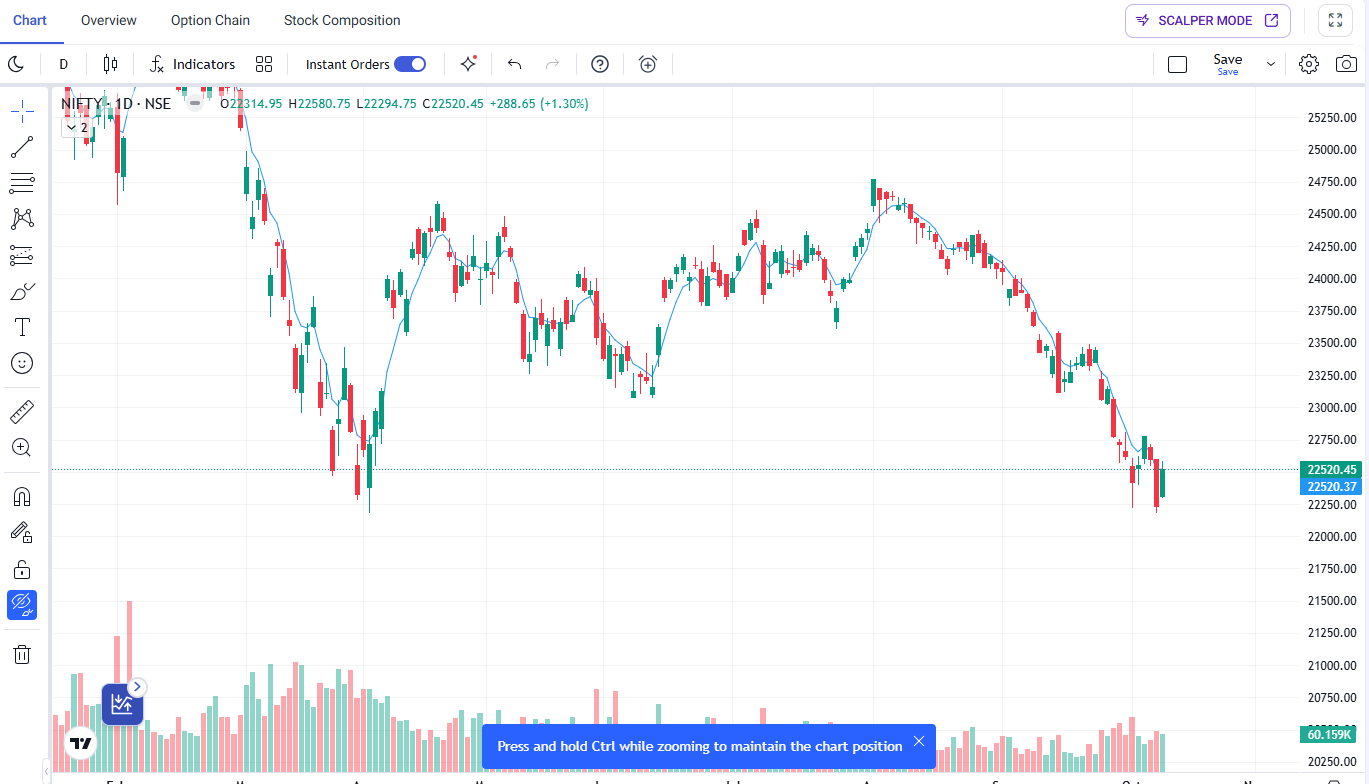
The NIFTY daily chart shows a clear bearish trend, with price declining from the 24,500–24,750 region toward 22,520. The recent price action indicates selling pressure, although the latest candles show a small recovery after testing lower levels.
Key Levels to Watch
- Resistance: 22,750–23,000
- Major Resistance: 23,250–23,500
- Immediate Support: 22,250–22,500
- Lower Support Zone: Around 22,000
These are approximate zones based on the displayed chart, not guaranteed turning points.
What Does the Chart Indicate?
Nifty is trading below its recent swing highs, and the price structure remains weak. The blue moving-average line also reflects the recent downward momentum.
If Nifty moves above nearby resistance with strong confirmation, a short-term recovery may develop. However, a break below the recent lows could increase selling pressure.
Trading Strategy
Avoid entering trades based on a single candle. Wait for price confirmation around key levels, define your stop loss, and maintain a suitable risk-to-reward ratio. Backtest any strategy before using real capital.
Final Thoughts
The current Nifty daily chart analysis suggests that the market remains under pressure near 22,520. Traders should monitor support, resistance, and price action before making intraday or positional trading decisions.
Disclaimer: This article is for educational purposes only and is not financial advice. Stock market trading involves risk, and all trading decisions should be based on your own research and risk management.